IISTracer lets you show a progress of the IIS problem and reveal probably reason of the problematic IIS state. You can monitor extremly slow or problematic ASP scripts (or other scripts - ASPX/ASPNet, .php, .cfm, .cgi …)
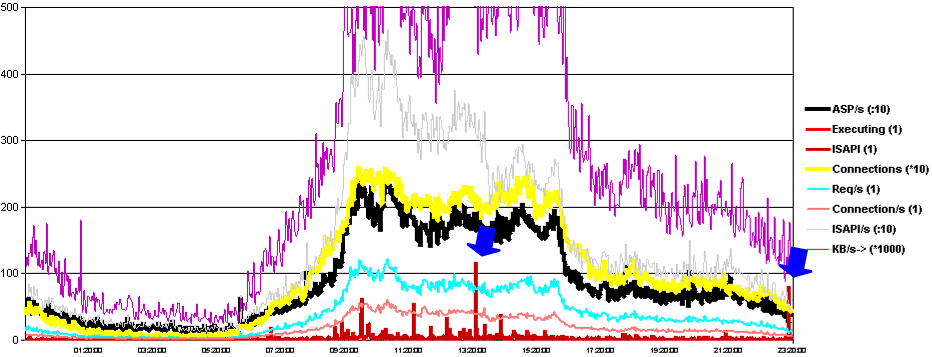
The chart bellow shows an usual load of IIS server during 24 hours. You can see number of requests per second to ASP pages (ASP/s, black), current number of connections (yellow), number of all requests per second (blue) and other significant values. You can get such chart from Windows Performance monitor or similar software.
The main performance value for monitoring of ASP scripts are a Current ISAPI extensions (dark red) or Request Executing (red) values. You can see that although the load of IIS has no boosts during the time, the number of running request has several peaks during the day. I marked problematic times by a blue arrow sign.
The main performance value for monitoring of ASP scripts are a Current ISAPI extensions (dark red) or Request Executing (red) values. You can see that although the load of IIS has no boosts during the time, the number of running request has several peaks during the day. I marked problematic times by a blue arrow sign.

You can see the number of non-served requests in 13:25 was over 100 and 23:18 over 80. The server slows down during the time (several minutes) and clients must wait for their data.
So this is the time for our IISTracer (If you have installed it, of course :-). We can go to IISTracer log, problematic time 13:25:
So this is the time for our IISTracer (If you have installed it, of course :-). We can go to IISTracer log, problematic time 13:25:
#Header-Fields: time nofactive nofcompletted reason maxrecords
#Header-Data: 13:25:46.867 50 25 nOfActiveUp(50) 50
#Fields: start-time last-time state client req-no sc-bytes sc-content-length cs-bytes cs-content-length instance-id method url all-raw
13:19:20.783 13:19:24.013 send 160.218.40.2 13340898 0 ns 24801 45493 2 GET http:// x.kde.cz /new/css/alia.css
13:24:14.379 13:24:15.075 send 62.77.75.165 13363790 0 ns 43186 42972 5 GET http:// aliashop.fin.cz /
13:25:04.264 13:25:04.557 send 85.160.16.61 13367662 0 ns 24825 45493 2 GET http:// x.kde.cz /new/css/alia.css
13:25:42.975 13:25:42.975 send 160.218.40.10 13370954 0 155 89 ns 5 POST https:// www.aliaweb.cz /util/login.dat?AC=G&
13:25:44.389 13:25:44.495 send 83.148.29.87 13371069 0 ns 58850 58662 7 GET http:// www.zpravodaj.cz /dpg_m103360.htm
13:25:49.169 13:25:49.169 head 66.196.90.41 13371403 0 ns 0 un 7 GET http:// www.zpravodaj.cz /dpg_m79327.htm
13:25:49.389 13:25:49.389 head 62.209.251.167 13371413 0 ns 0 un 6 GET http:// nazory.fin.cz /nazory/default.asp?A=V&T=80
13:25:49.671 13:25:49.671 head 193.84.33.171 13371429 0 ns 0 un 7 GET http:// www.zpravodaj.cz /dpg_m37998.htm
There are several scripts and static requests at the top of this list. The scripts are running a long time and they are probably the problem of IIS performance. IISTracer logged the data in 13:25:46.867, when the number of active requests was over 50. There was 50 latest running requests in the log, we can take a look at first of them.
http://x.kde.cz/new/css/alia.css is probably not the problem. The file is a static css file, which did not load the server. The problem will be probably with http://aliashop.fin.cz/ script, the script is running for up to 2 minutes (25:46-24:15).
http://x.kde.cz/new/css/alia.css is probably not the problem. The file is a static css file, which did not load the server. The problem will be probably with http://aliashop.fin.cz/ script, the script is running for up to 2 minutes (25:46-24:15).
#Header-Fields: time nofactive nofcompletted reason maxrecords
#Header-Data: 13:25:57.509 150 25 nOfActiveUp(150) 50
#Fields: start-time last-time state client req-no sc-bytes sc-content-length cs-bytes cs-content-length instance-id method url
13:19:20.783 13:19:24.013 send 160.218.40.2 13340898 0 ns 24801 45493 2 GET http:// x.kde.cz /new/css/alia.css
13:24:14.379 13:24:15.075 send 62.77.75.165 13363790 0 ns 43186 42972 5 GET http:// aliashop.fin.cz /
13:25:04.264 13:25:04.557 send 85.160.16.61 13367662 0 ns 24825 45493 2 GET http:// x.kde.cz /new/css/alia.css
13:25:42.975 13:25:42.975 send 160.218.40.10 13370954 0 155 89 ns 5 POST https:// www.aliaweb.cz /util/login.dat?AC=G&
13:25:49.169 13:25:49.169 head 66.196.90.41 13371403 0 ns 0 un 7 GET http:// www.zpravodaj.cz /dpg_m79327.htm
13:25:49.389 13:25:49.389 head 62.209.251.167 13371413 0 ns 0 un 6 GET http:// nazory.fin.cz /nazory/default.asp?A=V&T=80
13:25:49.671 13:25:49.671 head 193.84.33.171 13371429 0 ns 0 un 7 GET http:// www.zpravodaj.cz /dpg_m37998.htm
13:25:49.816 13:25:49.816 head 207.46.98.68 13371436 0 ns 0 un 7 GET http:// www.zpravodaj.cz /dpg_m97410.htm
13:25:49.962 13:25:49.962 head 193.165.245.246 13371445 0 ns 0 un 6 GET http:// nazory.fin.cz /nazory/default.asp?T66_PR205625.htm
IISTracer shows a progress of the problem - some time later, when the number of active requests reaches 150 and grows. The problematic http://aliashop.fin.cz/ script is still running. And you can see there is another script running , POST request to https://www.aliaweb.cz/util/login.dat script, running for 20 second. The problem may be also in combination of http://aliashop.fin.cz/ and the login.dat script.
#Header-Fields: time nofactive nofcompletted reason maxrecords
#Header-Data: 13:26:14.282 100 25 nOfActiveDown(100) 50
#Fields: start-time last-time state client sc-bytes sc-content-length cs-bytes cs-content-length instance-id method url
13:19:20.783 13:19:24.013 send 160.218.40.2 0 ns 24801 45493 2 GET http:// x.kde.cz /new/css/alia.css
13:24:14.379 13:24:15.075 send 62.77.75.165 0 ns 43186 42972 5 GET http:// aliashop.fin.cz /
13:25:04.264 13:25:04.557 send 85.160.16.61 0 ns 24825 45493 2 GET http:// x.kde.cz /new/css/alia.css
13:25:42.975 13:25:42.975 send 160.218.40.10 0 155 89 ns 5 POST https:// www.aliaweb.cz /util/login.dat?AC=...
13:25:50.281 13:25:50.281 head 212.80.76.38 0 ns 0 un 9 GET http:// www.otp.cz /Credit.asp?4682277
13:25:52.347 13:25:52.347 head 212.159.206.66 0 ns 0 un 6 GET http:// telefony.fin.cz /telefony/tarify.asp
13:25:54.709 13:25:54.709 head 212.159.206.66 0 ns 0 un 6 GET http:// telefony.fin.cz /telefony/tarify.asp
...
Once again some time later, number of active requests is under 100 and falls down. The problematic http://aliashop.fin.cz/ script is still running, along with POST request to https://www.aliaweb.cz/util/login.dat script. Other scripts (http://www.zpravodaj.cz/dpg_m79327.htm, http://nazory.fin.cz/nazory/default.asp?A=V&T=80 …] are finished, only the two problematic scripts are still running. The problem will be probably with them, specially with the http://aliashop.fin.cz/ page.